Agile Tools
Please download graphical tools based on our book Innovate Products Faster.
These product development templates are based on real life examples, and have been tested in the field with clients on multiple engagements. We often are stuck when first getting started working on a complex issue, because we don’t know how to take the first step. These graphical tools (graphs, charts, tables, and forms) are ready to go and can be modified for your needs.

Boundary Conditions Diagram
Identifies the critical elements of a project and defines the conditions which must exist for a team to ship a product to market. Enables a team to plan and execute with minimal management intervention.

Deliverable Hit Rate Chart
The Deliverable Hit Rate Chart monitors the progress of completed tasks against a target over time. It is a graph that indicates whether programs are staying on schedule by tracking the rate of task c...

Out-of-Bounds Check
Realigns teams after a project has gone out of scope. Provides the team with a mechanism to conduct a root cause analysis, evaluate alternatives, and recommend a remedy to decision makers.
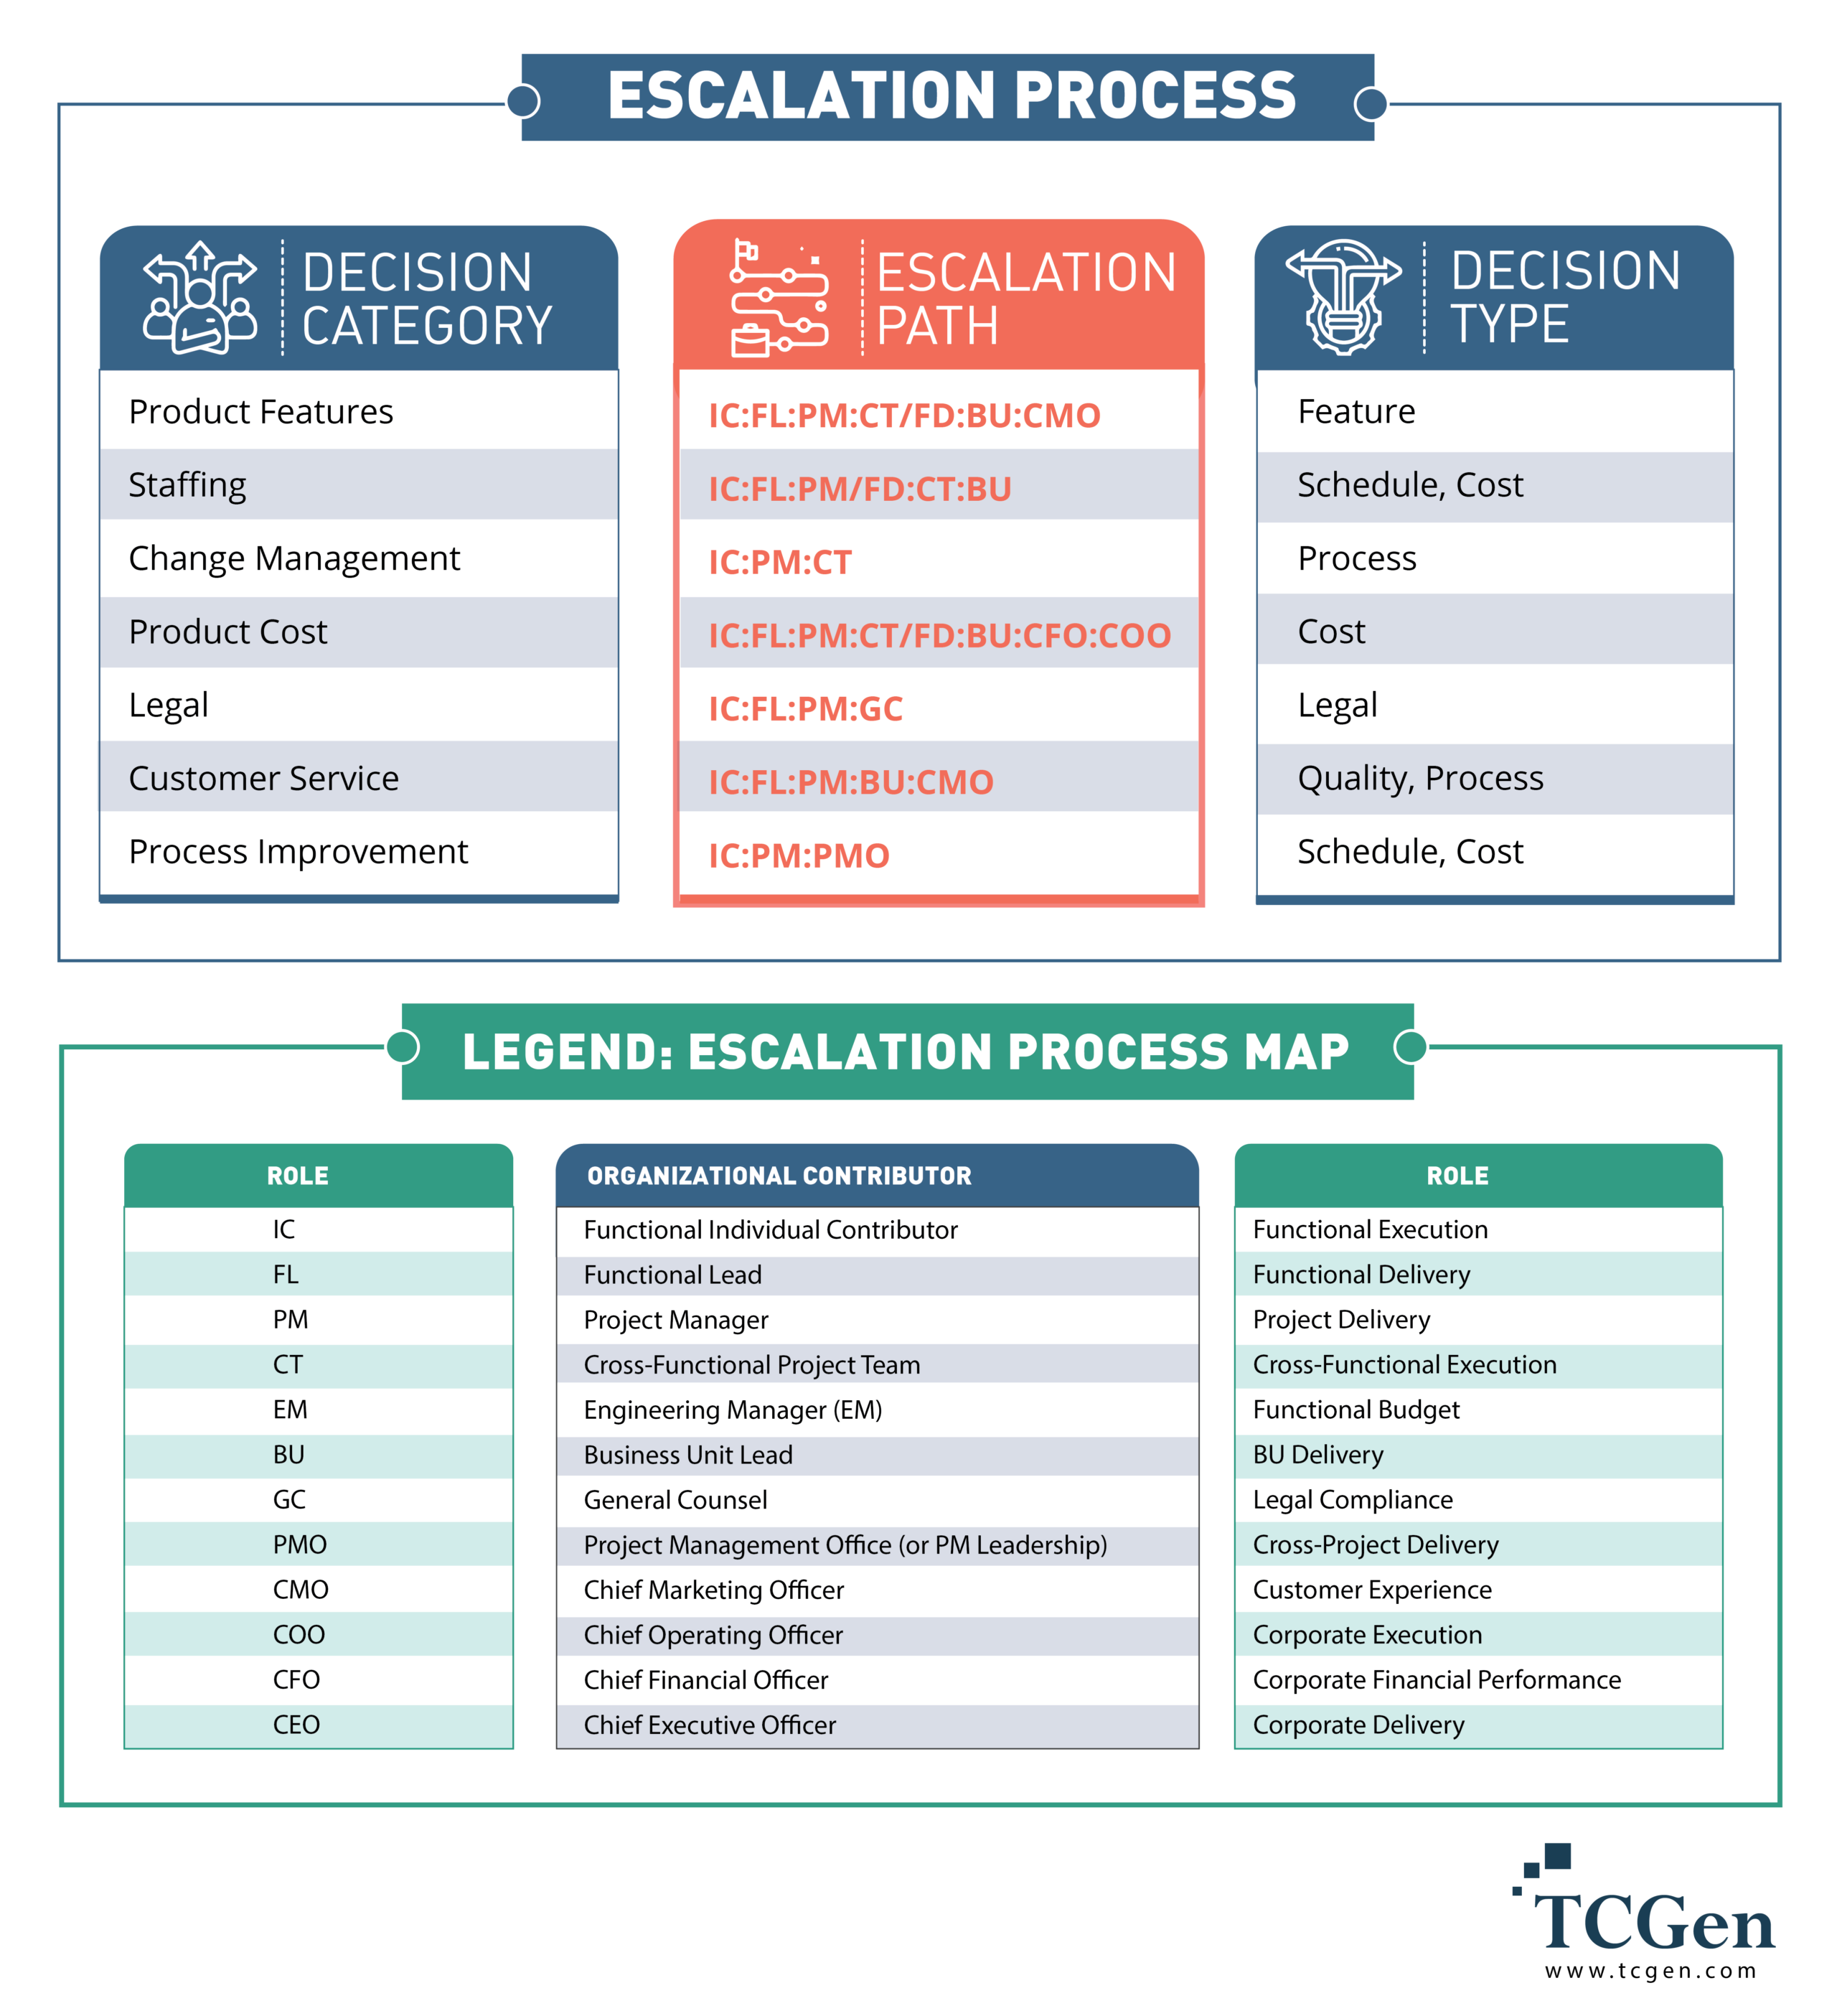
Project Escalation Map
Clarifies the boundaries and channels of decision making throughout an organization. Empowers teams, and minimizes the time and attention required by senior managers at the project level.

Risk Management Matrix
The Risk Management Matrix is an elegant way to anticipate, manage, and mitigate product development risks. The matrix is a table that prompts the team to identify risks, to rate their potential impac...