Skip to content
Schedule Prediction Accuracy. What’s New?
Measuring schedules is not new, but using a simple graphical tool that allows you to quickly monitor performance to the initial plan and check key drivers that can take you off course is a technique that is new to many organizations. This tool allows project teams to anticipate problems before they occur and to intervene before projects go off the rails.
What Is the Tool? Schedule Prediction Accuracy
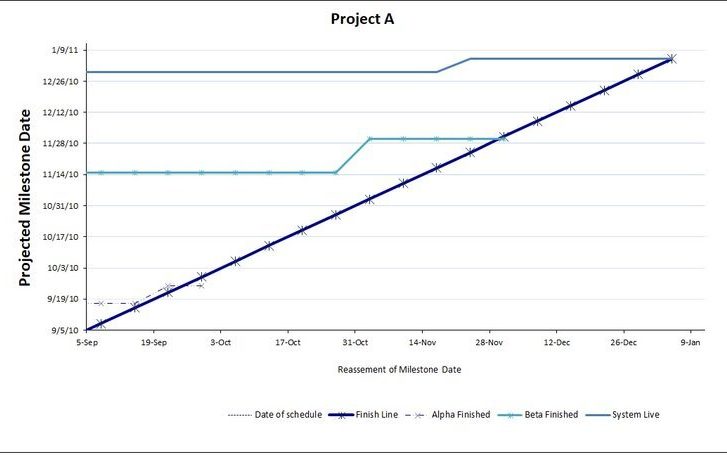
The Schedule Prediction Accuracy tool is an Excel X-Y scatter plot that visually represents the initial project schedule (Y-axis) against the current schedule (X-axis) for all major milestones. The tool is updated on a regular cadence (typically weekly). Ideally, if a project experienced no schedule impacts, each milestone would be represented over time as a horizontal line. When schedule changes are introduced (or anticipated), the impact is represented as an upward slope of the line. This tool also includes a “finish line”, which is a diagonal line that represents when each milestone should be reached based on the initial plan. The pre-populated template allows for quick updates (typically of less than 15 minutes) to the project’s major milestones. This tool is more accurate than the traditional Gantt chart and visually displays the impact of changes over the course of the project.
What Are the Benefits of Schedule Prediction Accuracy?
- Serves as an early warning sign to prevent projects from going off track
- Is a simple tool that requires very little time to update
- Provides a robust visualization of the entire project over time, with visual emphasis on significant changes in schedule
- Increases accountability for true performance to plan
- Eliminates the “gaming” that is often done to blur true project health
Which Business Problems Do We Solve with Schedule Prediction Accuracy?
- The Schedule Prediction Accuracy tool is an effective way to clearly communicate the health of a project. It provides the best opportunity to determine if the team will hit its schedule goals and allows the management team to make early decisions to mitigate risks before they occur. Unlike other methods that graphically represent performance to schedule, this tool frames the current condition in the context of the original plan to provide a better insight into the true performance of the project.
- In companies that are delivering multiple products simultaneously, this tool can be used to construct a dashboard to quickly assess the performance of the portfolio.
What Are some Considerations?
- Initially, there is a learning curve to construct and interpret the tool. Most organizations have relied on the traditional Gantt chart and are familiar with managing to the current snapshot of a project. This tool requires a reframing of how you look at schedule performance to plan.
- While this tool provides a clear assessment of the overall health of a project and the likelihood of achieving the project schedule goals, it doesn’t address the root causes that drive schedule impacts.
Case Study
A clean-tech startup is racing to deliver its first product to the market. Time to market is critical for them to hit their revenue commitments for the fiscal year. The product is structured to include multiple development releases before the final 1.0 release. The project manager has switched from the traditional Gantt chart to the Schedule Prediction Accuracy tool as a way of communicating the performance of the team, thus providing a better line of sight to the overall health of the project. The senior leadership team receives project updates on a weekly basis or on an as-needed basis when escalations occur.
Visualization