Project Efficiency: Getting More Done by Doing Less
Project Efficiency - What’s New?
Project overloading is anything but new. However it seems to be getting worse rapidly with the increasing speed of development, especially with SAAS (Software as a Service) and Web 2.0 development where releases can be pushed out daily. It appears to be that managers want to optimize their resources by loading them up and have them do more on the priority list to satisfy the executive suite. However, this is a false economy as it is neither improving project efficiency, nor does it lead to higher throughput. The optimum load is approximately 2 projects – one large and one small – far from what is seen at most organizations.
What Is the Tool? Talent Optimizer
For each specialty – project engineer, user interaction designer, project manager, tally up the number of initiatives each is working on – count every project, large or small. If there are tiny projects that are only 1-5% of their time, group them together and lump as one “small collection” and count as one project and assign it as one project, up to 10% of an individual’s time. Create a histogram, adding up the number of a given function with only 1 project, those with only 2 projects and so on up to 7 projects. Divide this by the total number of individuals in a function to get a percentage distribution.
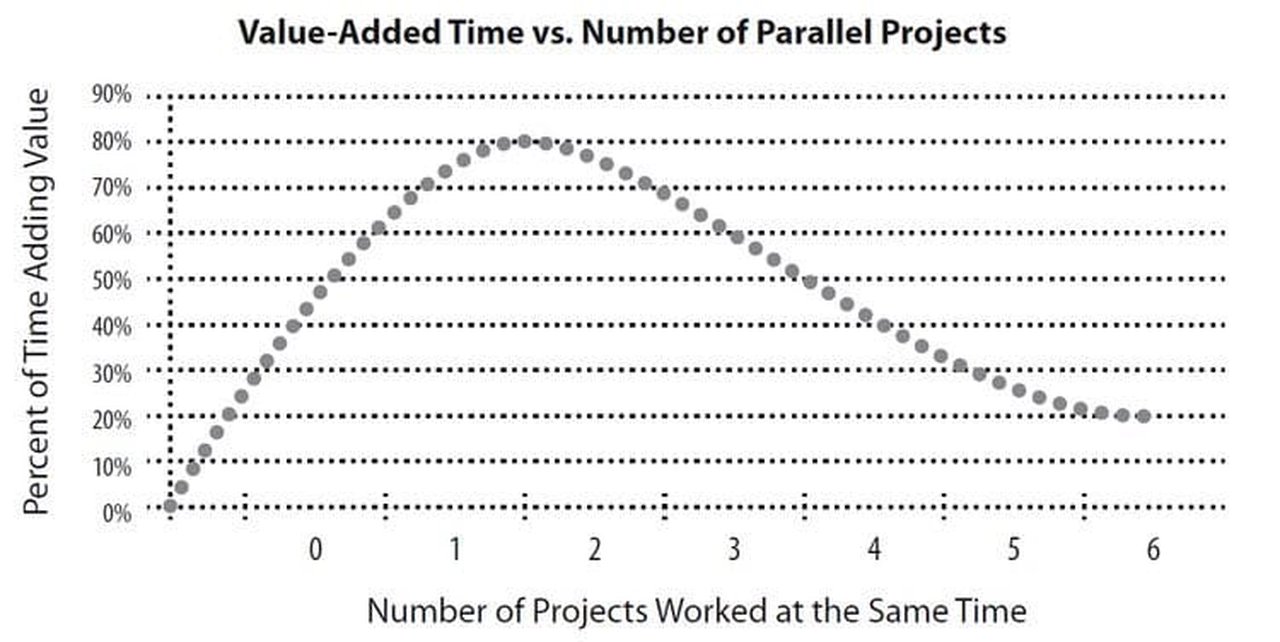
From extensive research on this topic, a curve of value added time versus number of parallel projects has been derived for engineers – from 1-7 projects. The peak happens between 1-2 projects, where about 65% of the time an engineer spends is value added. This work applies to other product development functions as well.
Then, this allocation can be plugged into the talent optimizer spreadsheet and it will predict the average valued added contribution of the organization. By looking at this result (usually shocking as to the low net productivity) the organization can relook at the priority list and push some of the now projects into the next category.
What Are the Benefits of this Graphical & Numerical Technique?
- Provides a visual map of overload
- Exposes overburdened developers
- Helps project management normalize workload to maximize project efficiency (and morale)
Which Business Problems Do We Solve with Project Efficiency?
In most organizations, we are trying to get the most out of the talent, but the tendency of a project manager and especially executives is to load up the project management team. Individuals and managers wanting to advance don’t “say no” to the additional tasks so the workload grows over time. The analog is like birds in a bird cage, where the birds are analogous to projects. As more and more birds are added the cage, the ones at the bottom get sick and some die. In the real world this leads to projects that never finish and worse yet, often the most important projects don’t get done when they should.
This tool provides a sanctify check of the overload and can be used strategically with a priority process where project efficiency is implemented and projects can be bucketed into “now”, “next”, and “never”. It also puts a spotlight on individuals (and functions) that are being unfairly abused.
What Are some Considerations?
Obviously, projects come in all different degrees of complexity, and in some cases a given individual can handle many, many projects at the same time if they are simple. Also, some individuals are more adept at managing project efficiency and handling more than one project at any one time. So this tool needs to be applied with judgment. If your projects are typical product development activities, however, this model applies well to most situations and can lead to project success.
Case Study
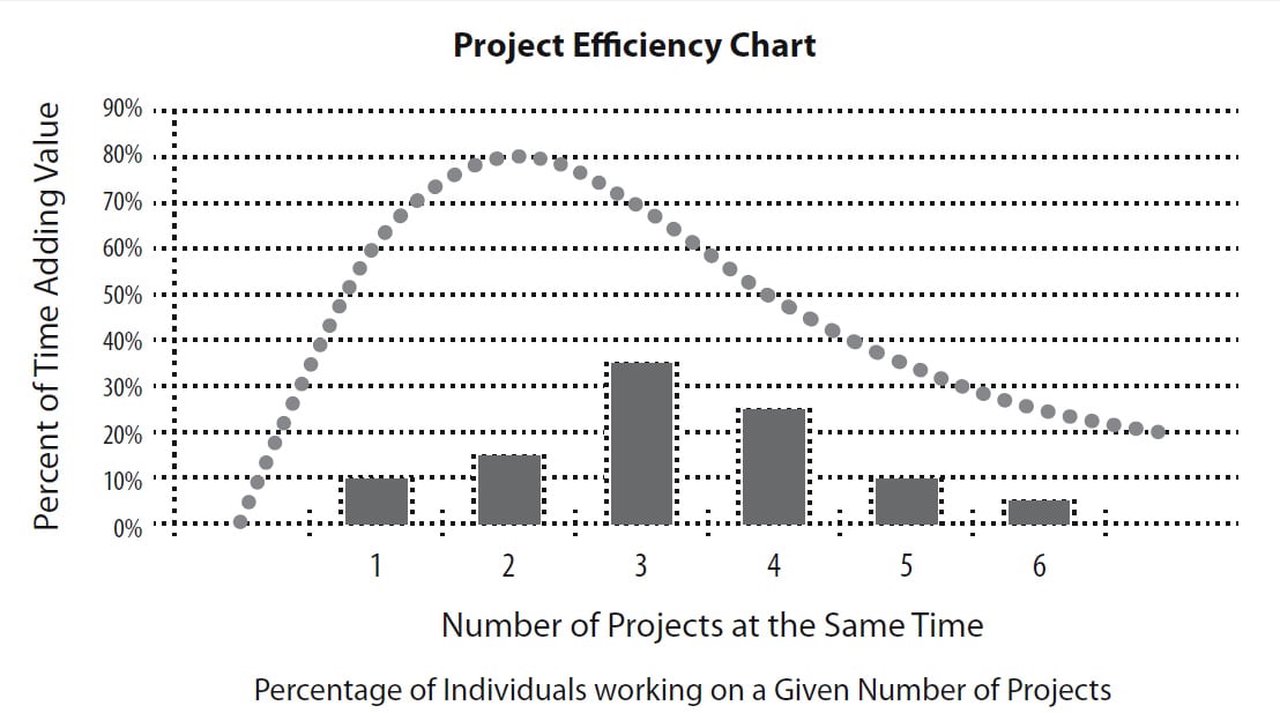
A technology organization with about 100 contributors was having trouble with morale and projects that kept slipping. An analysis of the root causes did not reveal the usual suspects of changing definition, too few project managers, or too much technical risk. However, the engineers complained of long days and nights and at the same time demands by the project management that they attend many non project related meetings. The VP of Engineering wondered if they were spread too thin, and did a simple tally of the organization and counted the number of projects (including project management initiatives for training, process improvement, supervisory training, and the like). Here is what she found:
1 Project 10
2 Projects 15
3 Projects 35
4 Projects 25
5 Projects 10
Visualization