Process Improvement Tools
These product development templates are based on real life examples, and have been tested in the field with clients on multiple engagements. We often are stuck when first getting started working on a complex issue, because we don’t know how to take the first step. These graphical tools (graphs, charts, tables, and forms) are ready to go and can be modified for your needs.

Circle Dot Chart
This simplified RACI helps you clarify who owns what decisions within a project.
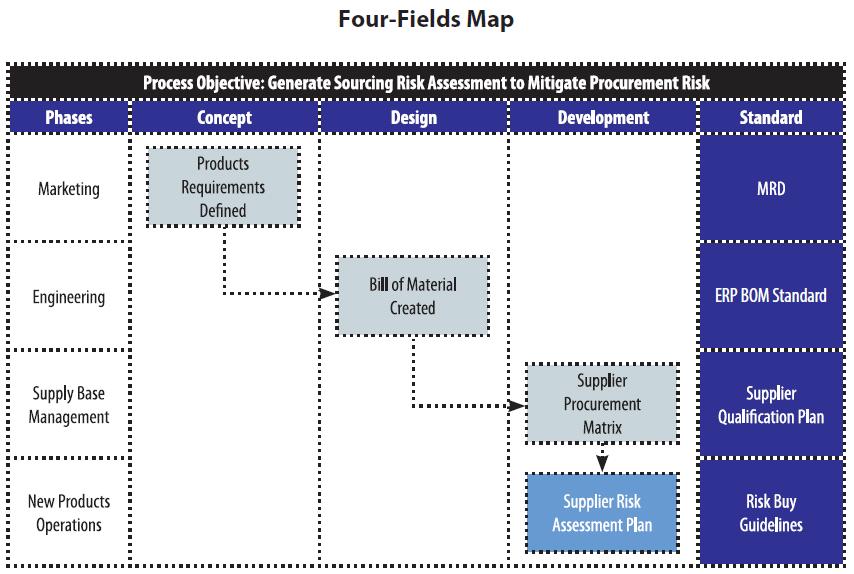
Four-Fields Map
The Four-Fields Map is a graphical technique most commonly applied to cross-functional processes. It emphasizes the elements of task, teamwork, and quality, with a focus on how you do the work rather...

Lite and Precise Schedule Estimating Matrices
The Lite Schedule Estimating Matrix is a parametric tool that helps estimate the time to complete a given phase of a project. It creates a rough estimate using past experience combined with the critic...
Project Retrospective Methodology
This overview of the TCGen methodology is utilized for Project Retrospectives and Process Reviews. These are conducted as a series of workshops that help a team constructively build a prioritized cons...

Root Cause Diagram
The Root Cause Diagram is a framework that helps you discover the ultimate cause of any outcome. Also known as the Fishbone or Ishikawa diagram, it is a graphical representation of an evidence-based m...

Schedule Prediction Accuracy Chart
The Schedule Prediction Accuracy Chart provides an early warning when a project fails to hit the schedule. This tool allows project teams to anticipate problems before they occur, and to intervene bef...
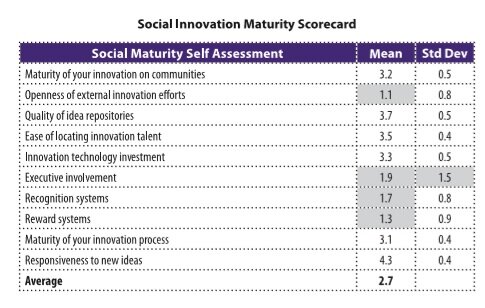
Social Innovation Maturity Scorecard
Social Innovation enables organizations to tap the wisdom of the crowd, both inside and outside of your company. The Social Innovation Maturity Scorecard helps determine your organization's maturity l...
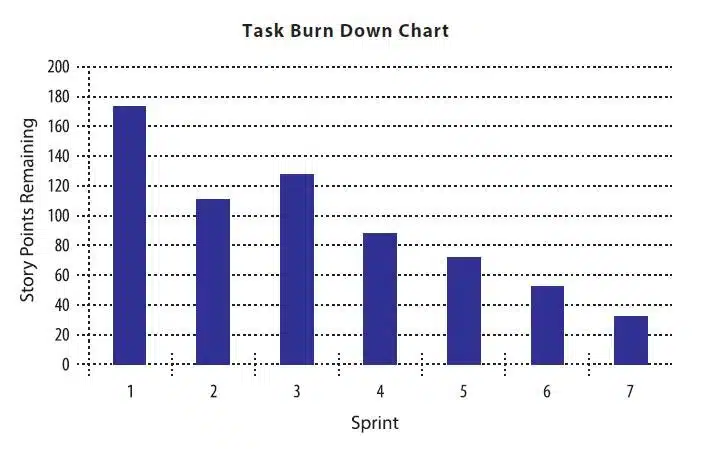
Task Burn Down Chart
Shows the team and management how much progress they are making on a project. An improvement on Gantt Charts in that it focuses on customers, and provides a more accurate estimate of the work performed on a project in-progress.

Team PERT Chart
Breaks projects down into tasks, shows the dependencies of one work stream on another, and provides real estimates, created by the people who actually perform the tasks.