Tools
We have taken some of our book’s most useful and powerful tools and made them available on-line. The tools below use templates in Microsoft Office (Word, Excel and PowerPoint) to provide you with a head start. Some of the most popular tools relate to product development strategy. The tools themselves include detailed instructions on how to apply them. In our book, Innovate Products Faster, you can learn more about the tools. If you have any questions, please send us a note. Helps shift the debate about funding new innovation projects, from the political to the strategic.
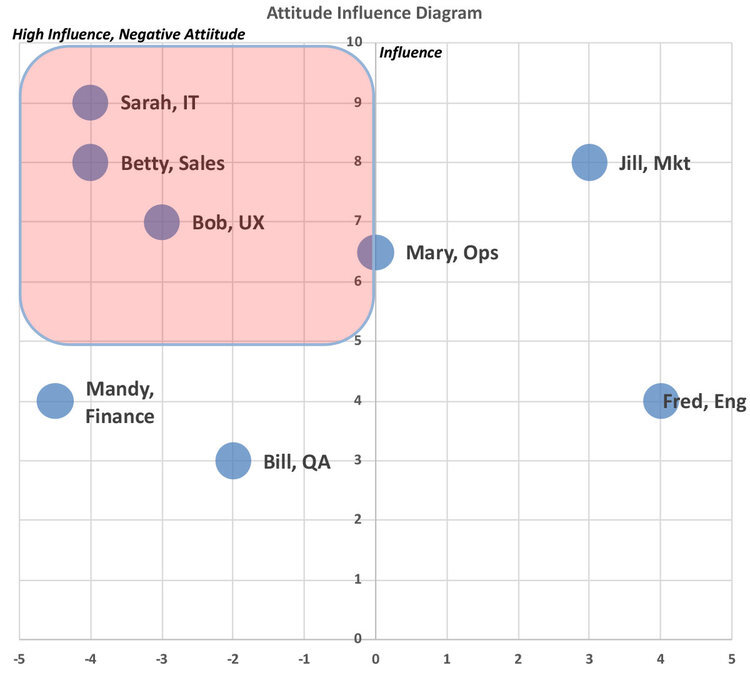
Attitude Influence Diagram
Help identify and manage the key individuals who might impede your success by determining your project's supporters and detractors. This product development process tool is a subjective assessment tha...

Boundary Conditions Diagram
Identifies the critical elements of a project and defines the conditions which must exist for a team to ship a product to market. Enables a team to plan and execute with minimal management intervention.

Change Impact Matrix
A descriptive template that helps project teams prepare for the future and serves as a discussion guide for planning risk-mitigation activities.

Circle Dot Chart
This simplified RACI helps you clarify who owns what decisions within a project.

Comparative Funding Model
This tool helps shift the debate about funding new innovation projects from the political to the strategic. By looking at your funding levels over time, it helps to communicate to business unit manage...
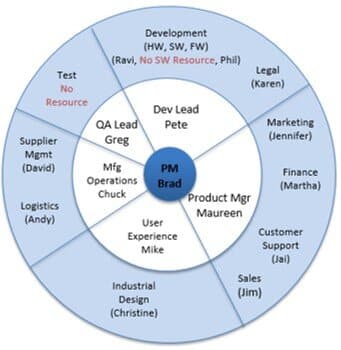
Cross Functional Team Model
The Cross Functional Team Model is a tool to identify the leadership, critical functions, and key individuals in a cross functional team. It is a snapshot that identifies, by name, the functional reso...

Deliverable Hit Rate Chart
The Deliverable Hit Rate Chart monitors the progress of completed tasks against a target over time. It is a graph that indicates whether programs are staying on schedule by tracking the rate of task c...
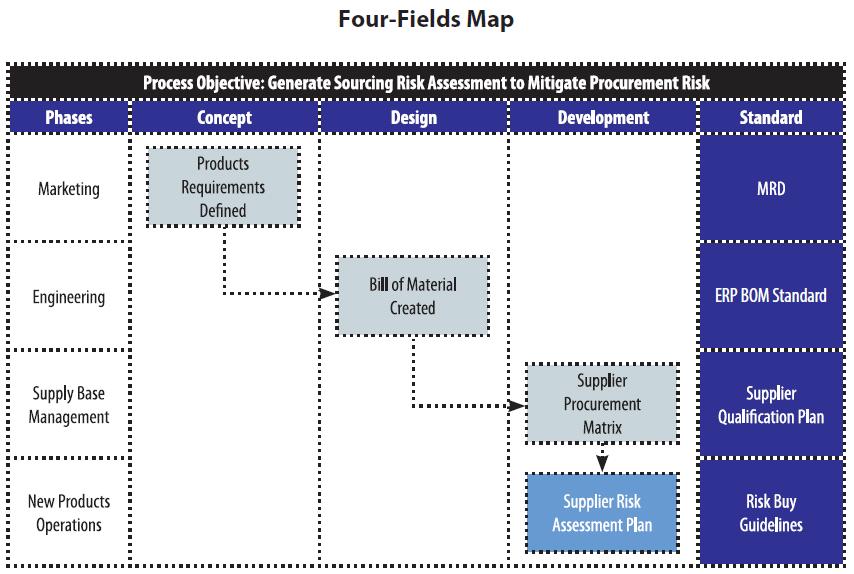
Four-Fields Map
The Four-Fields Map is a graphical technique most commonly applied to cross-functional processes. It emphasizes the elements of task, teamwork, and quality, with a focus on how you do the work rather...
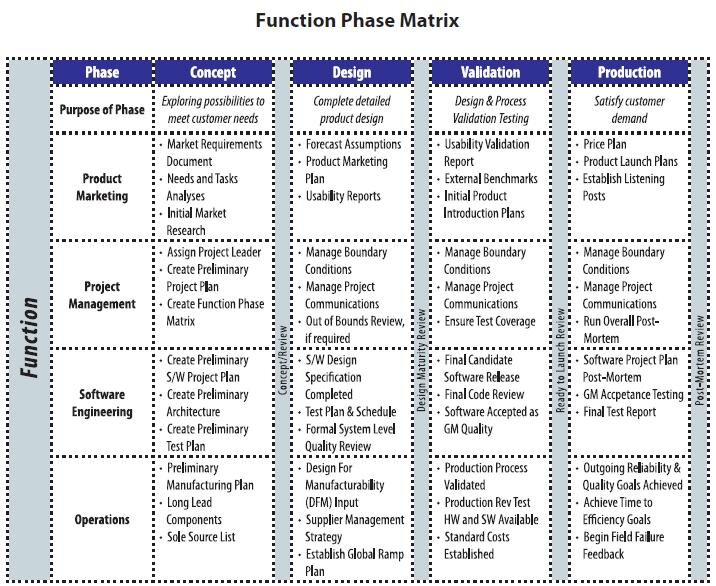
Function Phase Matrix
Helps a cross-functional project team to identify project objectives, roles & responsibilities, and key deliverables across the phases of a project. Identifies dependencies between team members and deliverables.

Innovate Products Faster
Graphical Tools for Accelerating Product Development

Jump Starting Teams
New programs spin up every day, but most teams get off to a bad start. In a rush to get going, they forego a few simple steps that would help position their programs for success. What’s new is a simpl...

Lite and Precise Schedule Estimating Matrices
The Lite Schedule Estimating Matrix is a parametric tool that helps estimate the time to complete a given phase of a project. It creates a rough estimate using past experience combined with the critic...

Out-of-Bounds Check
Realigns teams after a project has gone out of scope. Provides the team with a mechanism to conduct a root cause analysis, evaluate alternatives, and recommend a remedy to decision makers.

Product Derivative Chart
A Product Derivative Chart is a diagram that depicts a set of related products over time. It shows related products that share underlying design components. It also shows the lifecycle of the platform...

Product Development Strategy Process
Effective product development strategy connects long-term goals to the daily management of product concepts. A strategic product planning process links together the company's vision, with the strategi...
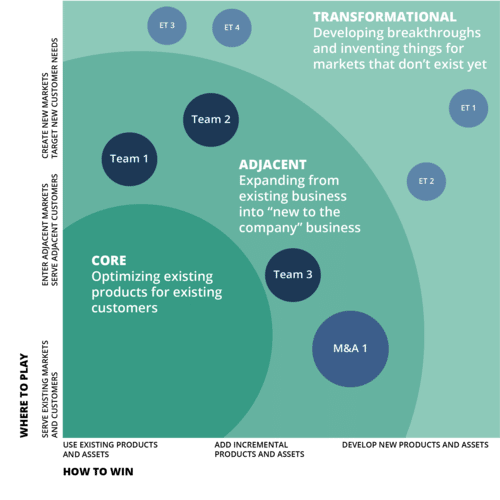
Product Portfolio Management Framework
The Product Portfolio Management Framework enables an intentional allocation of R&D and Marketing investments that realizes a risk/reward mix as determined by overall corporate strategy. By diagrammin...

Product Radar Chart
The Product Radar Chart offers a way to evaluate and communicate the factors that go into product and portfolio decisions by graphing the key dimensions of a product or concept against alternatives. I...

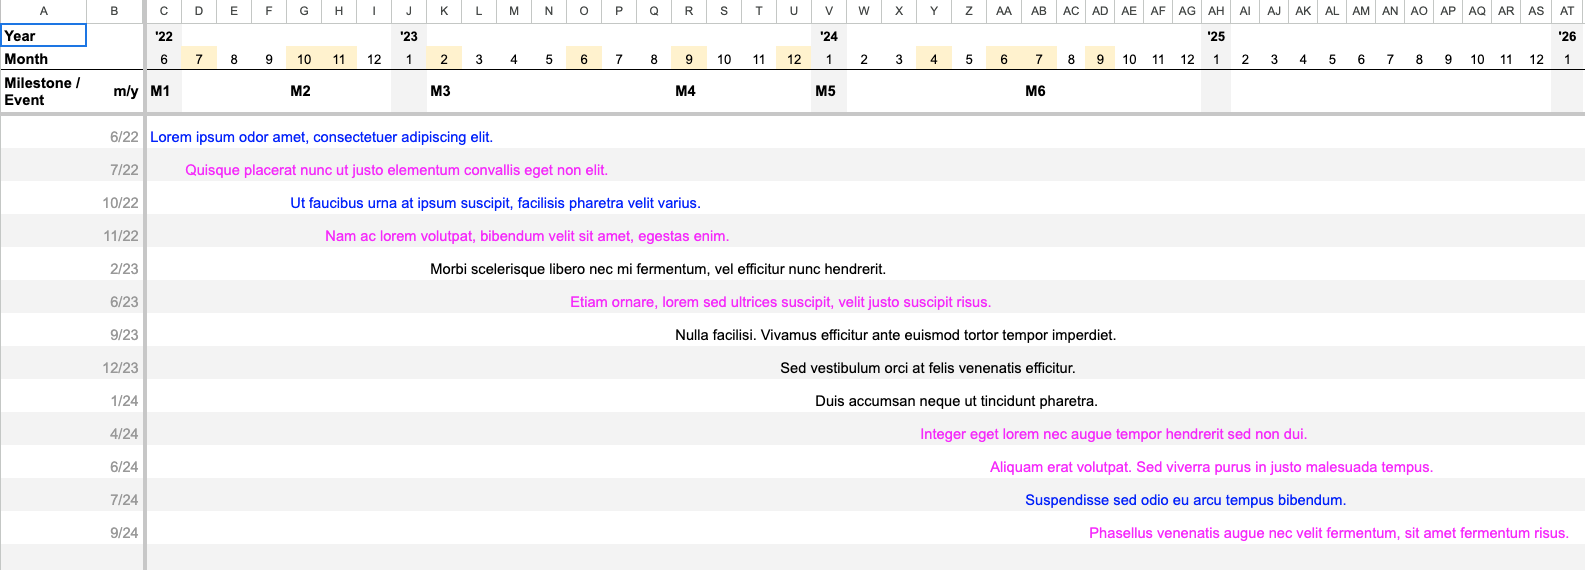
Product Roadmap
The Product Roadmap is a visual explanation of a company's strategy. It helps align engineering, marketing, sales, support, and the C-suite toward common product development goals. Product Roadmaps in...
Product Vision & Selection Criteria Tool
The Product Vision & Selection Criteria tool offers a way to evaluate the many factors that go into product and portfolio decisions by ensuring their alignment with product development strategy, and a...

Project Efficiency Chart
Estimates the amount of time a project team has available to create useful work output, based on the number of projects per person. Provides a visual map of resource overload and exposes overburdened functions.
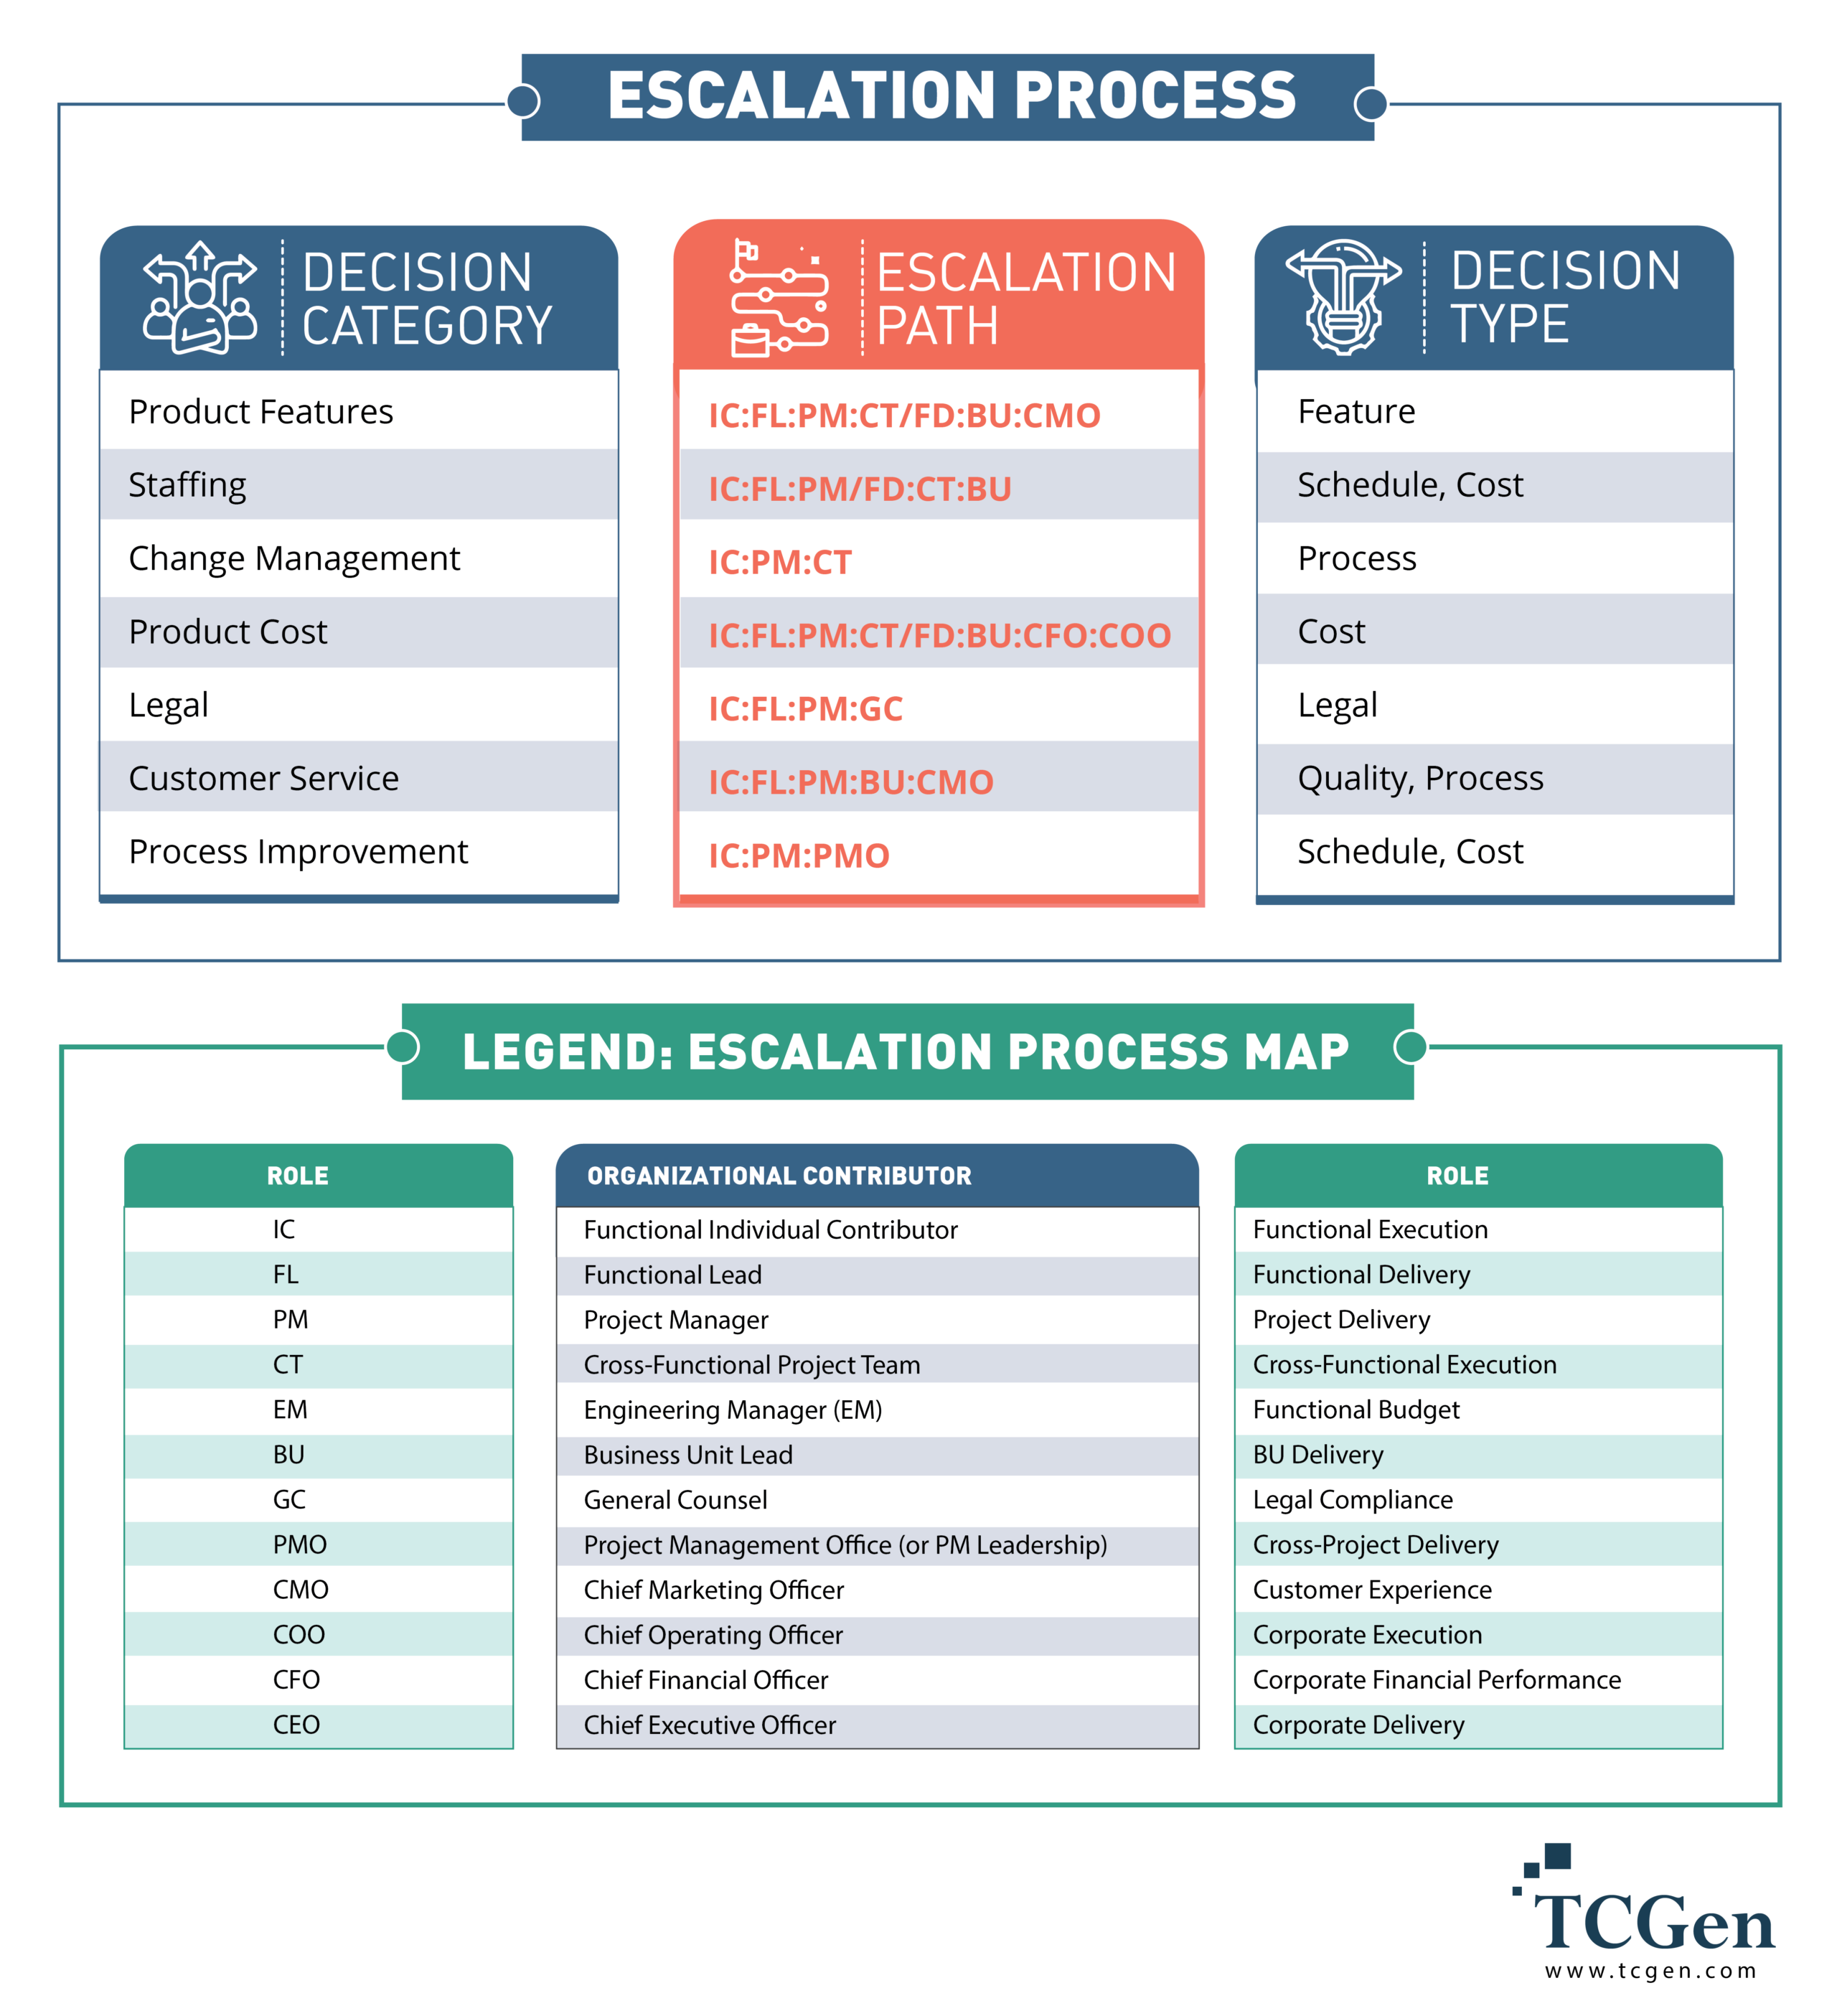
Project Escalation Map
Clarifies the boundaries and channels of decision making throughout an organization. Empowers teams, and minimizes the time and attention required by senior managers at the project level.
Project Retrospective Methodology
This overview of the TCGen methodology is utilized for Project Retrospectives and Process Reviews. These are conducted as a series of workshops that help a team constructively build a prioritized cons...
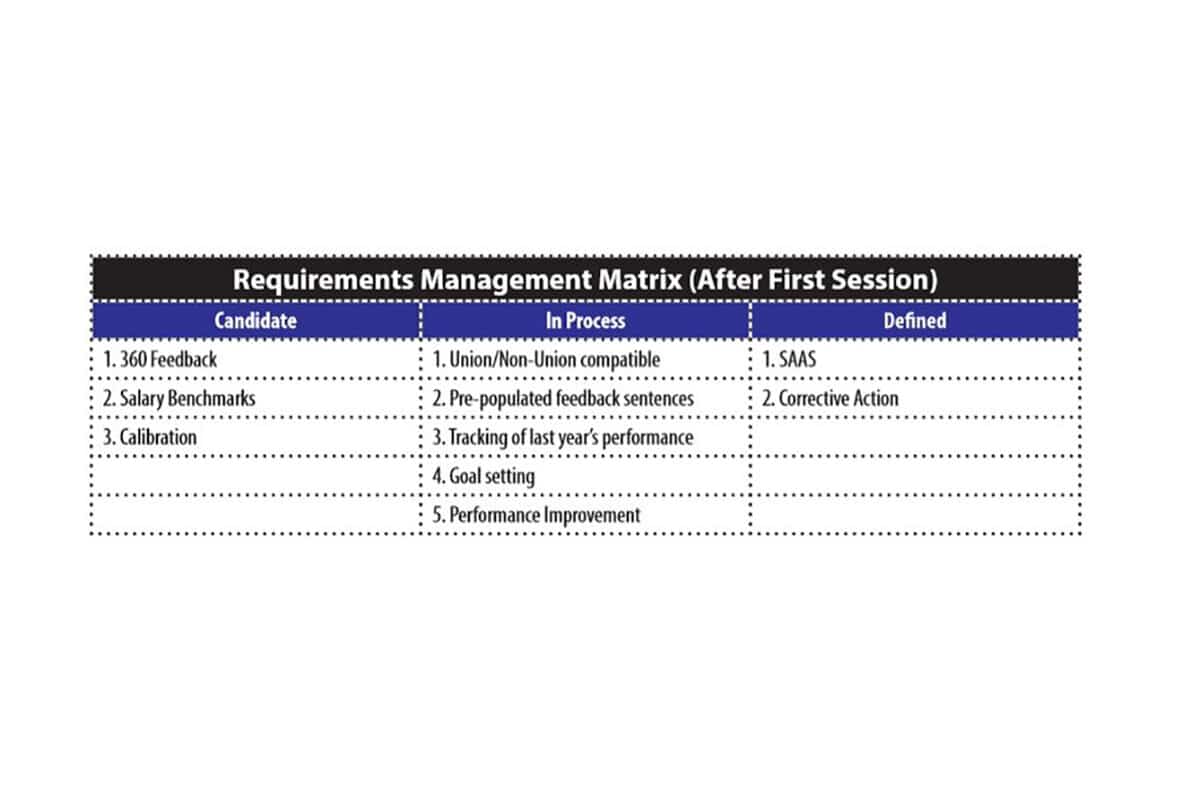
Requirements Management Matrix
The Requirements Management Matrix applies best practices from Agile development. This light weight tool helps ensure that your key product requirements are well-defined and understood. Also included...

Risk Management Matrix
The Risk Management Matrix is an elegant way to anticipate, manage, and mitigate product development risks. The matrix is a table that prompts the team to identify risks, to rate their potential impac...

Root Cause Diagram
The Root Cause Diagram is a framework that helps you discover the ultimate cause of any outcome. Also known as the Fishbone or Ishikawa diagram, it is a graphical representation of an evidence-based m...

Schedule Prediction Accuracy Chart
The Schedule Prediction Accuracy Chart provides an early warning when a project fails to hit the schedule. This tool allows project teams to anticipate problems before they occur, and to intervene bef...

Social Community Matrix
Companies are using social solutions to help accelerate innovation and product development by creating a managed virtual community. In these communities users share ideas, build on them through collab...
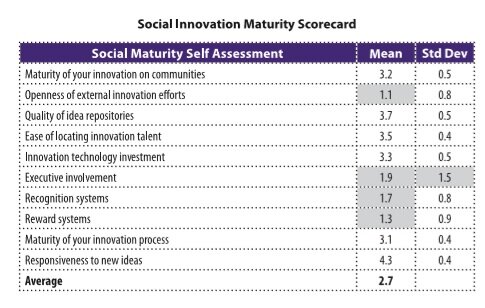
Social Innovation Maturity Scorecard
Social Innovation enables organizations to tap the wisdom of the crowd, both inside and outside of your company. The Social Innovation Maturity Scorecard helps determine your organization's maturity l...

Social Innovation Readiness Scorecard
The Social Innovation Readiness Scorecard is a decision-making tool that provides executives and teams with an objective view of their organization's capability to implement social solutions for produ...

Staffing Ratio Matrix
The Staffing Ratio Matrix identifies overloaded individual contributors and functional bottlenecks. It indicates the relative number of projects per function, enabling better resource allocation, fast...
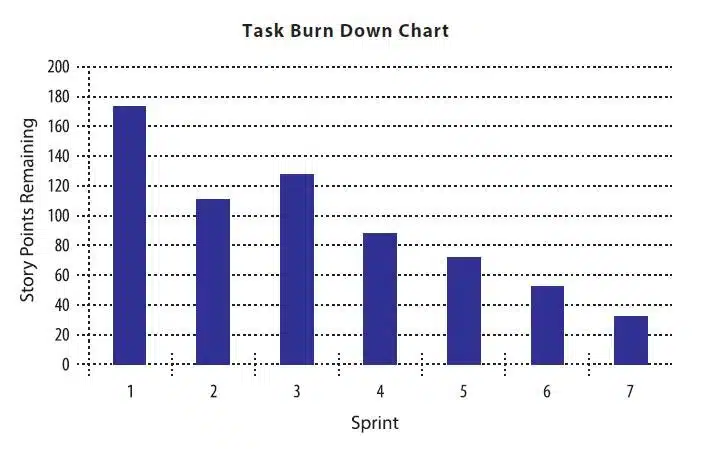
Task Burn Down Chart
Shows the team and management how much progress they are making on a project. An improvement on Gantt Charts in that it focuses on customers, and provides a more accurate estimate of the work performed on a project in-progress.

Team PERT Chart
Breaks projects down into tasks, shows the dependencies of one work stream on another, and provides real estimates, created by the people who actually perform the tasks.

Technology Roadmap
Technology Roadmaps help teams determine which technologies to incorporate into a given product. They help anticipate risks by enabling a degree of visibility into the future. They reveal potential ar...
Get Your Tool
This tool is available for download. Contact us to access this resource.
Request Tool Access